Track Lead Generation Performance with Reports
The RWS Dashboard gives agents performance metrics for new prospects and messages in real time. Reports help the agent gain insight into the effectiveness of their lead generation strategies.
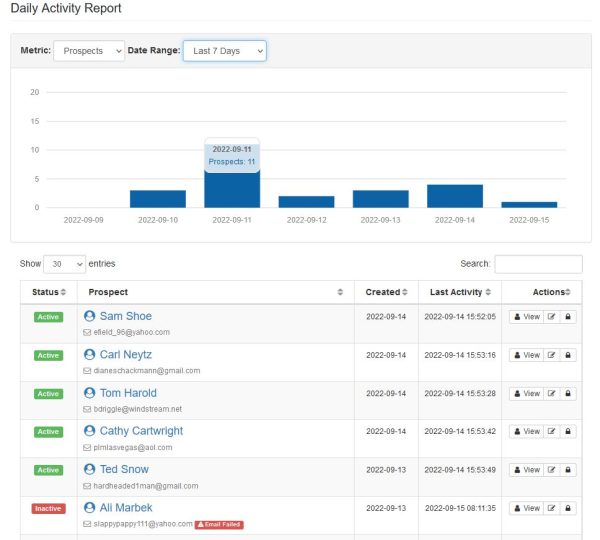
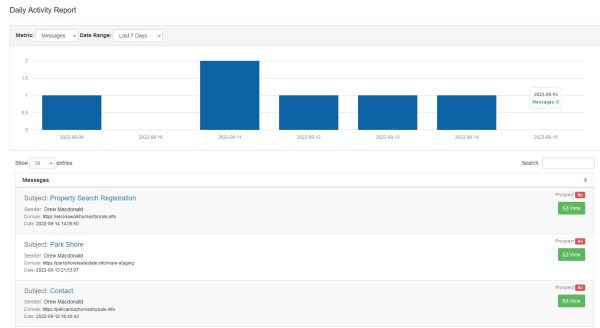
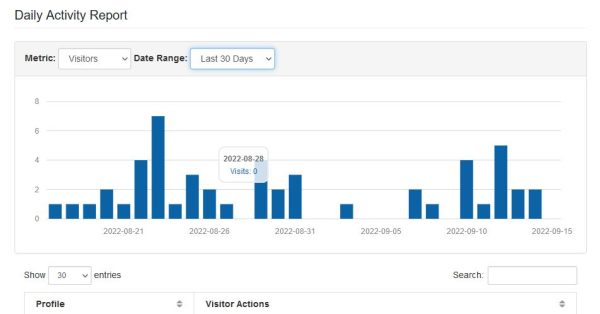
Daily Activity Report
The Daily Activity Report provides a bar graph and table list of recent activity for the selected metric and past date range.
Report Options
- Choose Your Metric - Using the Metric dropdown, you can select from messages, prospects or visitors. The default metric is for messages.
- Choose Your Date Range - Using the Date Range dropdown, you can select either the last 7 days, 30 days, 60 days, or 90 days. The default date range is for the last 7 days.
Prospects Report
The Prospects Report provides a bar graph of new prospects that register each month for the past 12 months.
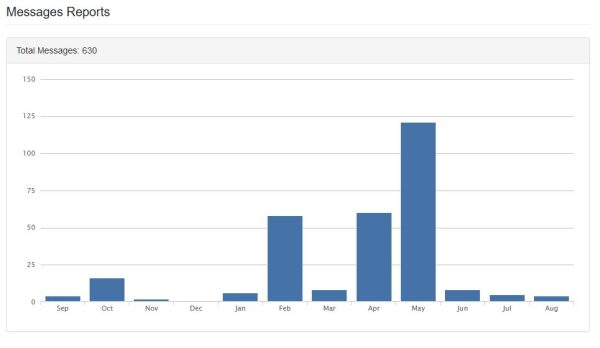
Messages Report
The Messages Report provides a bar graph of total messages generated each month for the past 12 months.
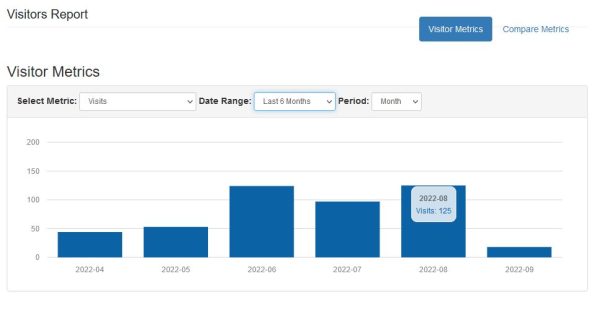
Visitors Report
The Visitors Report provides a bar graph of recent activity for the selected metric, date range, and period. Track key performance indicators such as visits, unique visitors, visit length, bounces, pageviews, returning visits and more.
Report Options
- Choose Your Metric - Using the Metric dropdown, you can select from visits, unique visitors, visit length, bounces, pageviews, returning visits and more. The default metric is for visits.
- Choose Your Date Range - Using the Date Range dropdown, you can select either the last 7 days, 30 days, 60 days, 3 months, 6 months, 12 months. The default date range is for the last 7 days.
- Choose Your Period - Using the Period dropdown, you can select either daily, weekly or monthly.
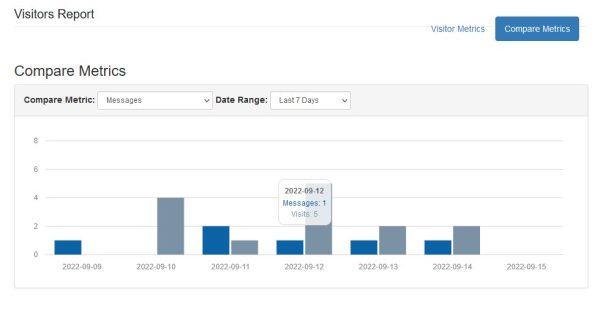
Compare Metrics
The Compare Metrics provides a bar graph of recent activity for visits and the selected compare metric, and date range. Compare key performance indicators such as messages, prospects, unique visitors, visit length, bounces, pageviews, returning visits and more.
Report Options
- Choose Your Compare Metric - Using the Compare Metric dropdown, you can select from visits, unique visitors, visit length, bounces, pageviews, returning visits and more. The default compare metric is for messages.
- Choose Your Date Range - Using the Date Range dropdown, you can select either the last 7 days, 30 days, 60 days, 3 months, 6 months, 12 months. The default date range is for the last 7 days.
- Choose Your Period - Using the Period dropdown, you can select either daily, weekly or monthly.